| Capabilities Home |
|
|
|
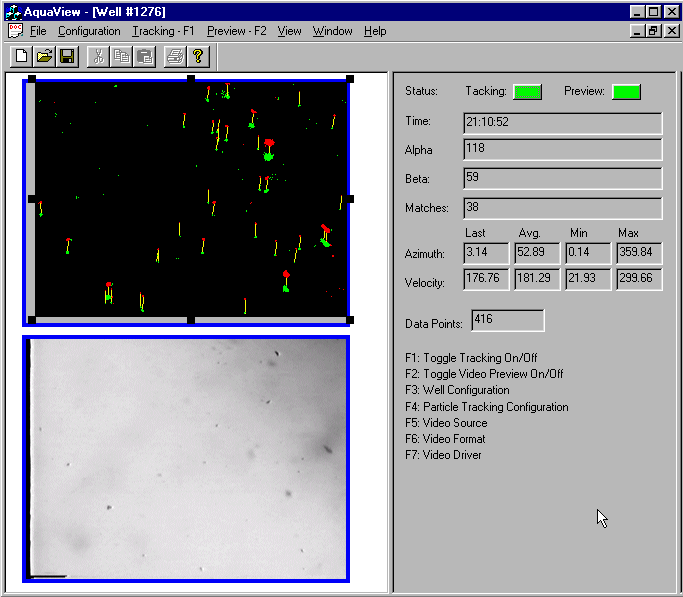
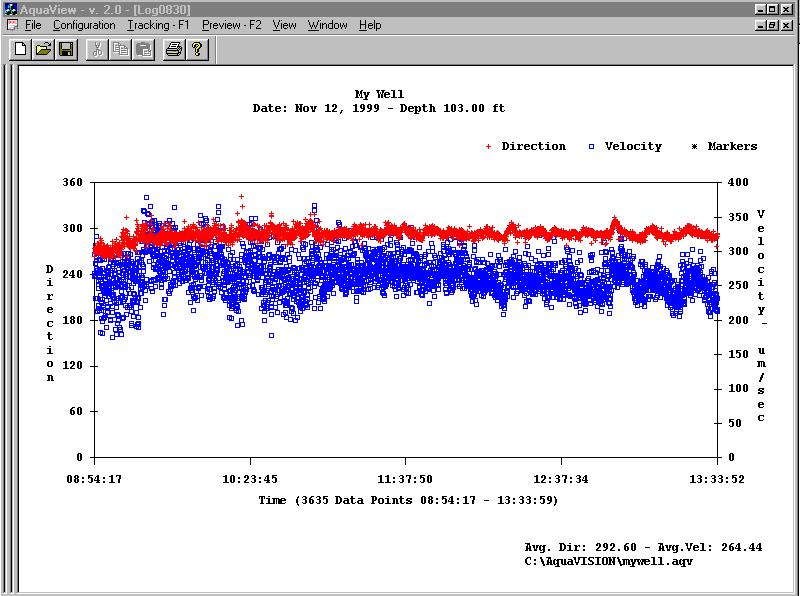
AquaLITE Software AquaVISION's AquaLITE software allows the user to view both the actual video signal from the borescope and a symbolic representation of particle movements at the same time. The software is fully configurable, to allow for changes in video signal quality, groundwater clarity, etc. The software also allows the user to view the sampled data in directional, velocity or combined graphs, all in real-time. The graphs are fully customizable. The graph images, as well as the sampled data can be exported for use in other applications and/or presentations. The software offers a
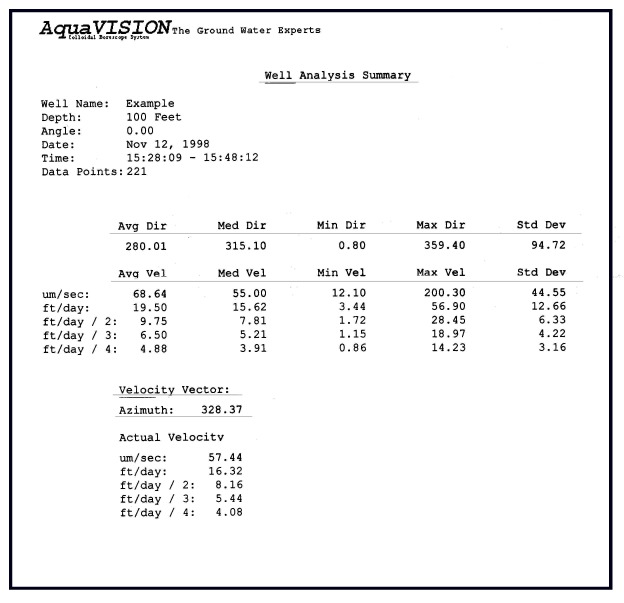
statistical summary report for the user. The report gives the well, date and data information, general statistical analysis, and a vector analysis.
The summary report may be exported for use other applications and/or
presentations. |
|